The Buffet Indicator (BI) is an approach which hinges on the assumption that the stock market is the barometer of the economy. Holding this assumption to be true, we can assume that in the long run, the markets should only rise (or fall) as much as the economic activity in any nation. How true is that? Let’s find out.
Before we
analyze the Buffet Indicator, let us first understand WHAT it is. The Buffet
Indicator is simply the ratio of the prominent market index of the economy
(such as NIFTY, SENSEX, NIFTY 500, Dow Jones, Hang Seng, NASDAQ etc.) and the
GDP of the country. While the market index is a fairly simple number daily
updated on the stock exchange, the GDP is a little more tricky.
The most widely published numbers for GDP in any economy are the GDP growth rate reported on a quarterly and annual basis with YoY growth (or decline) in constant currency terms. This immediately poses 4 problems
- GDP is not reported as a number but as a growth rate
- Which GDP to take? GDP or GDP per capita or GDP (PPP) or some other variant of economic activity
- The growth rate is not in terms of the immediately preceding quarter but the quarter in the year before
- The GDP indicator is in real terms while the market index is in nominal terms
The first
two problems can be resolved fairly easily. Along with the GDP growth rate, the
GDP can also be easily found with some searching. However, we prefer a method
wherein we take any arbitrary number for GDP at a certain point in time, and
taking the growth rates from there. This is very similar to NIFTY being
initiated at a value of 1,000 on 22 Apr 2016. As we’re only interested in the
Market-to-GDP ratio, the initial figures are meaningless and we’re only
interested in the ratio. In fact, we can use the growth rate of any indicator
of economic activity and use the ratio against it. If GDP seems to be an unfair
method, we can use any other measure like total funding by banks or total
exports by a country or total number of internet users in a country. But by
far, we find GDP to be the truest measure of economic activity in a country.
The third
problem can be tackled by adjusting the GDP growth rate for the annual figures
published by the Government or any authentic source such as the World Bank.
Another way to approach the problem would involve some mathematical working to
take YoY growth figures for every quarter for the market values. We prefer the
former method of working.
The fourth
problem can be dealt in two ways. We can either add the inflation figures to
the GDP growth rate, or we can choose to find and use the nominal GDP growth
rates. Less prudent investors may still choose a third approach – ignoring
inflation. This holds true for an economy where the inflation is static.
However, inflation has been very volatile in the past in India. Still, taking a
value of inflation opens another pandora’s box which is beyond the scope of
this article. For the purposes of this article, we have ignored inflation and
assumed the inflation to be consistent in the long run.
BI assumes
that the measure of economic activity taken is consistent in the long run.
However, every decade or so there are fundamental changes in the way GDP is
calculated and reported. While one Government may want to highlight nominal GDP
figures, another may choose to focus on GDP per capita and the news reports
will follow. Consistency is key in long term valuation studies. Another
assumption taken by the BI is that the market is a meaningful measure of
economic activity and while the same may not seem to be true looking at
everyday variations in the stock market, the same does hold true in the long
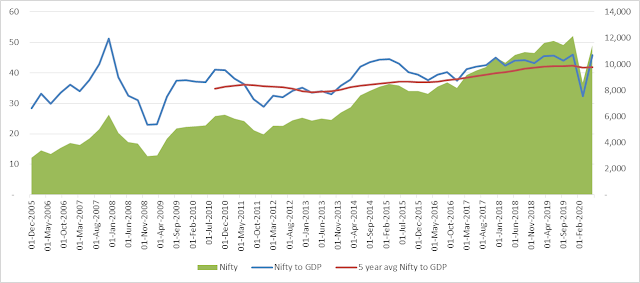
run as evidenced from the graph below.
As seen in the graph, the 5 year average of the Buffet Indicator is a fairly stagnant ratio. Assuming there are no big variations in the GDP growth rate in the short-term, we can assume most of the variation in the Buffet Indicator is attributable to the variation in the market. The assumption is confirmed by the fact that the Buffet Indicator moves in tandem with the market. Whenever a big difference with the average arises, the market sees a sharp movement in the opposite direction (but don’t hold us to this). At the time of writing this article, the CY 2020 Q2 GDP figures have recently been published and the Buffet Indicator is 9% higher than its 5 year average. Are we looking at a sharp correction soon?


No comments:
Post a Comment